See Your Risk Before You Trade
Build options portfolios, visualize P/L curves, and model how time, volatility, and adjustments change your risk—updated live with real market data.
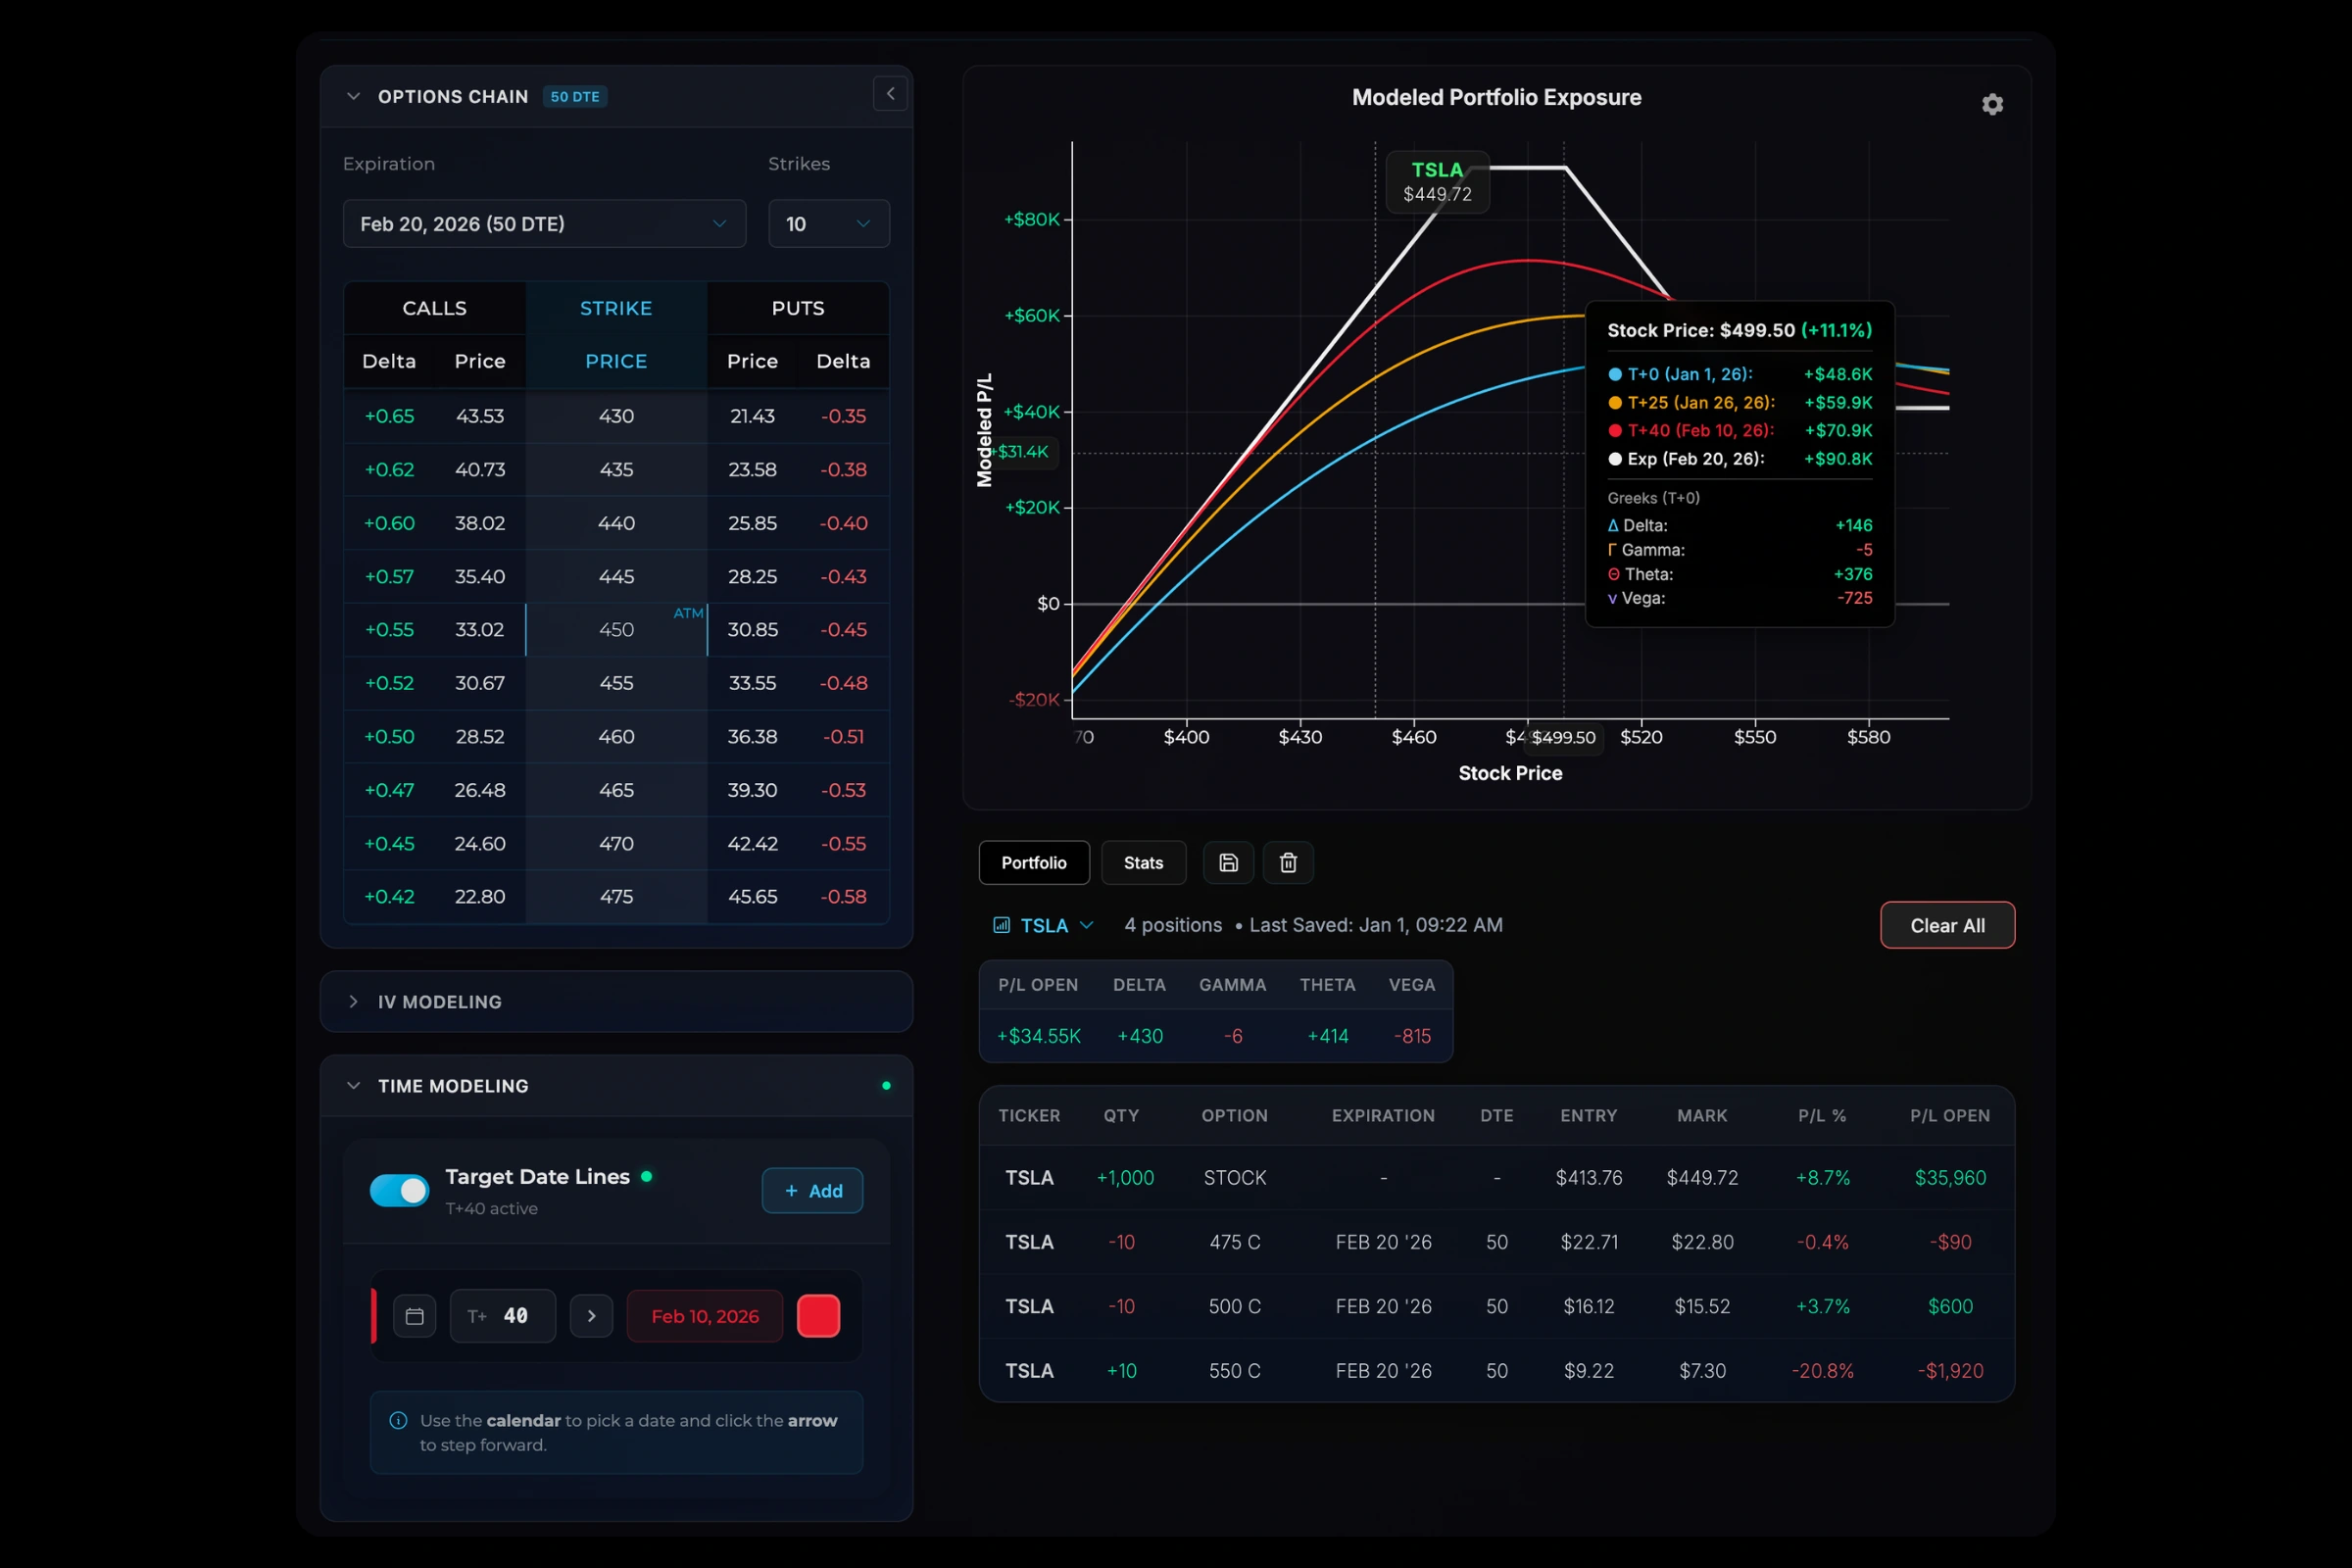
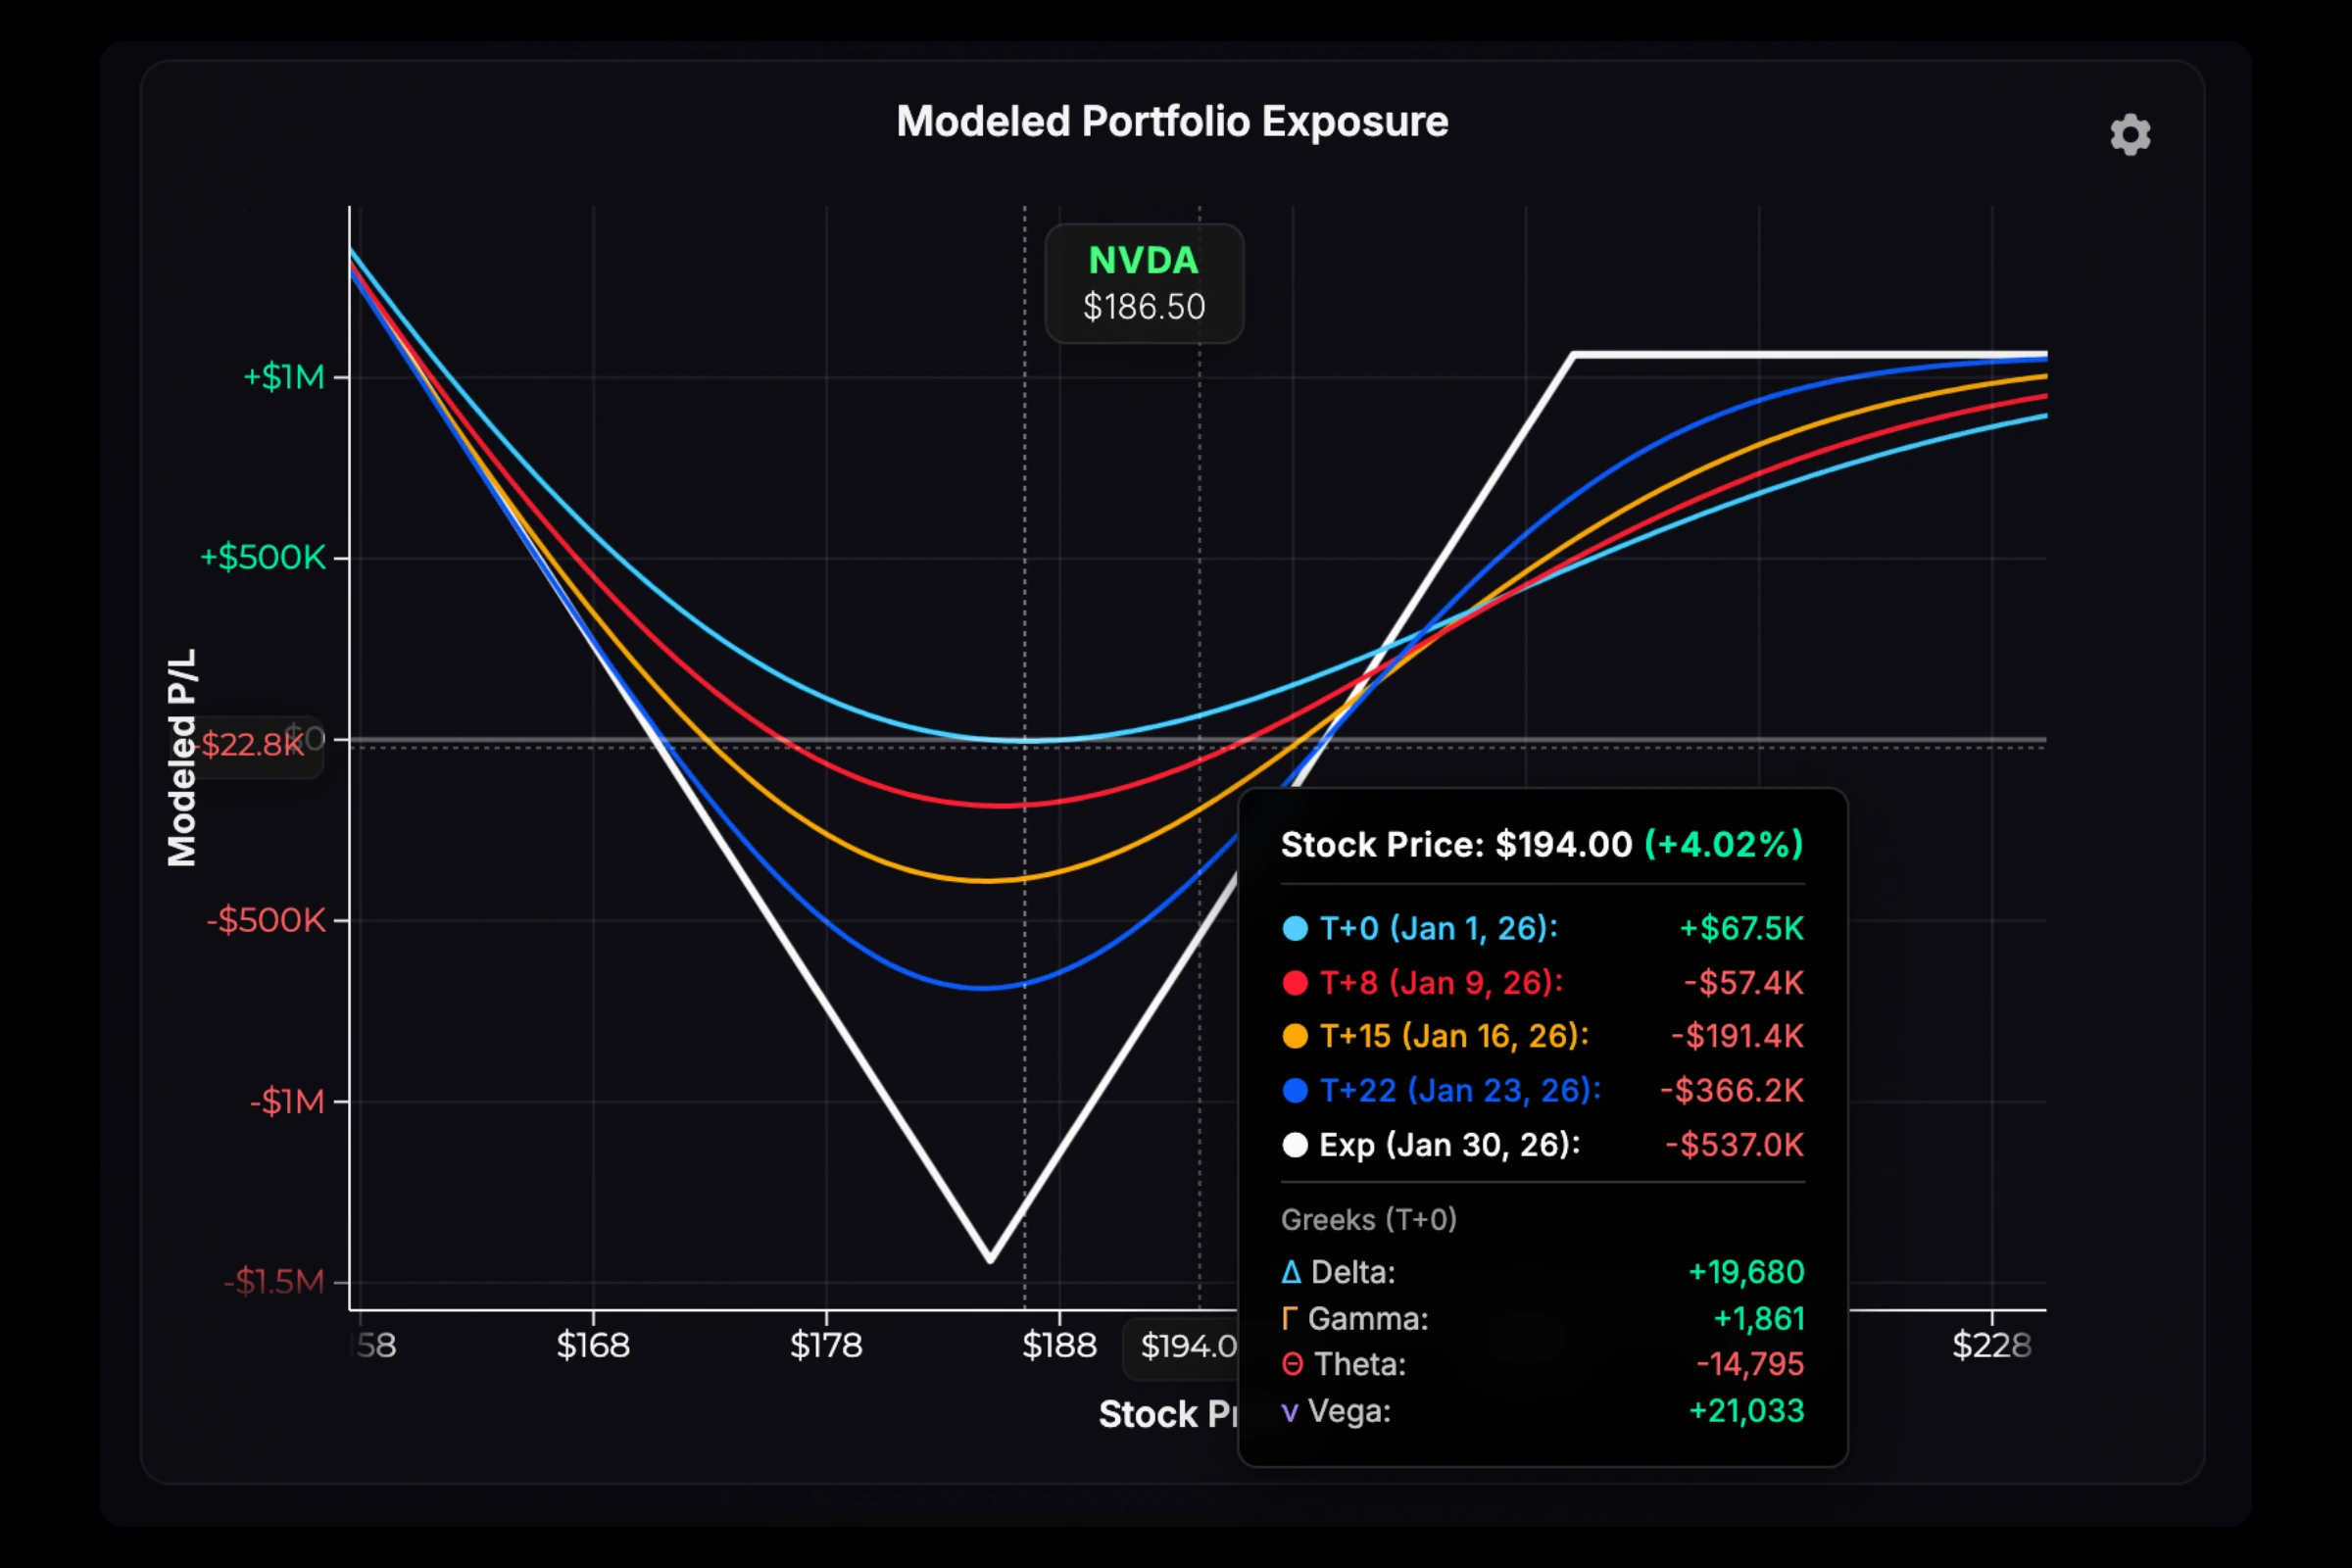
P/L Visualization
Your full position at a glance. Breakevens, profit zones, and max loss—updating live with the market.
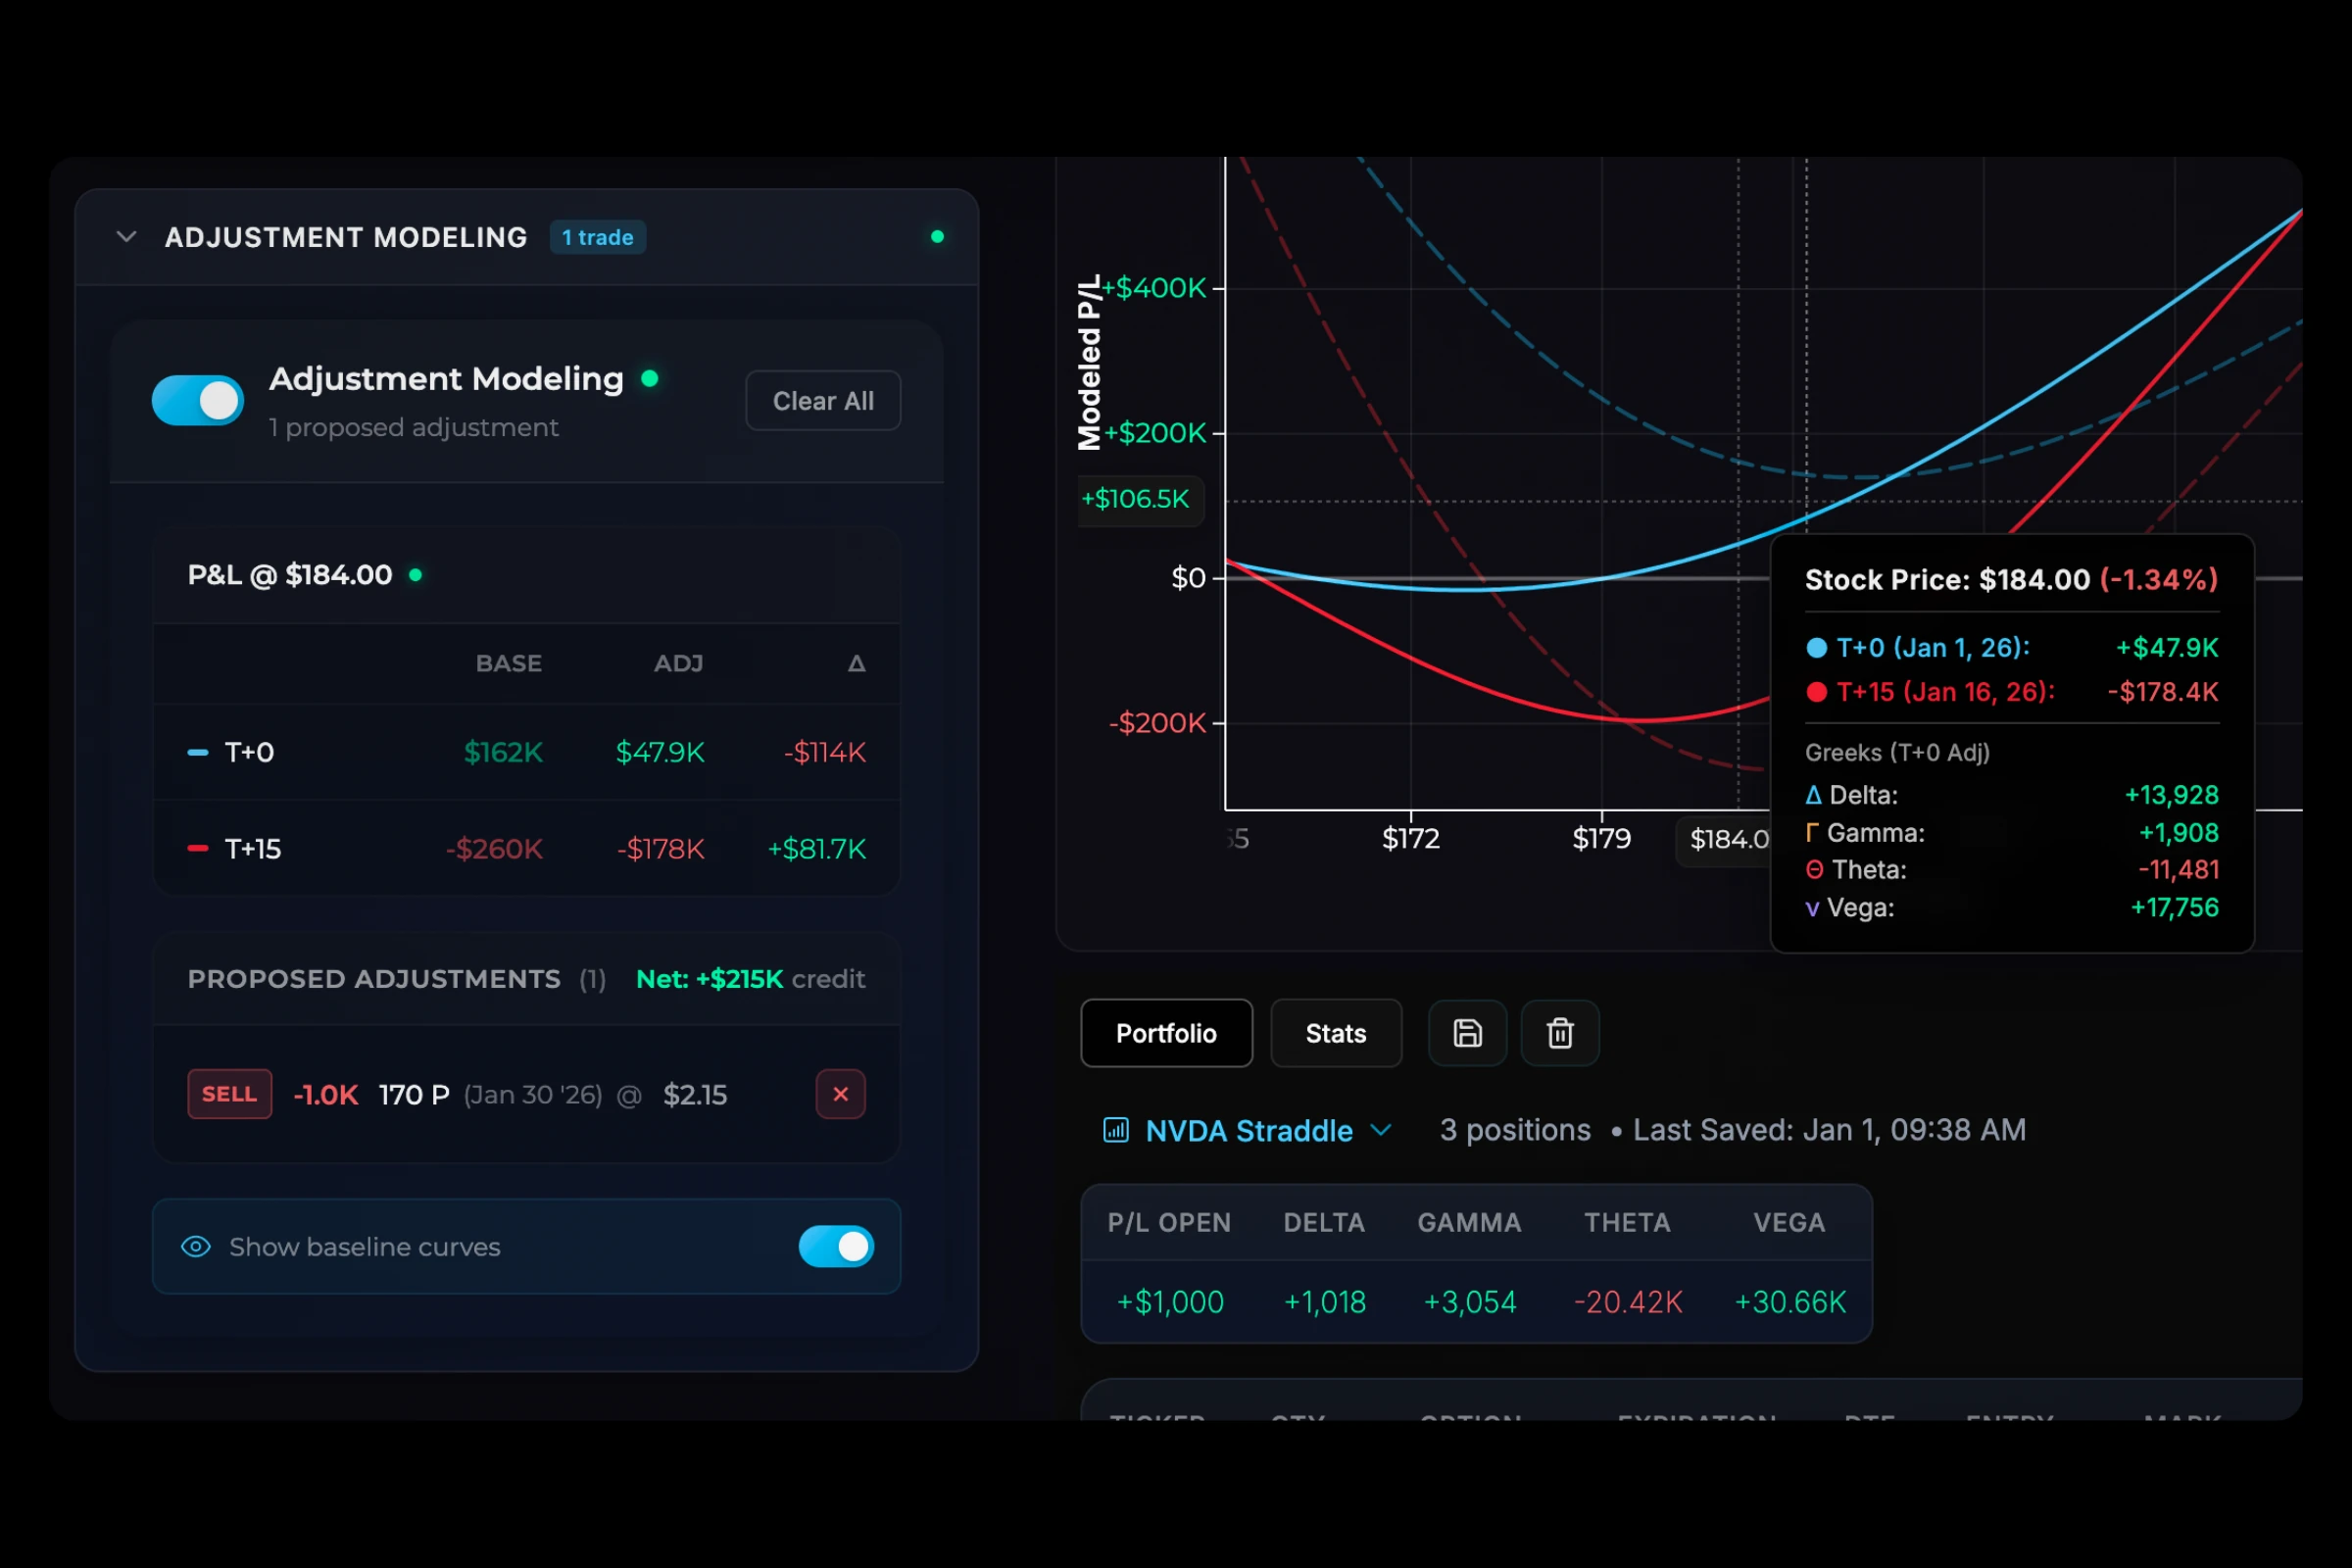
Adjustment Modeling
Model adjustments before you commit. Compare your current position against proposed changes side-by-side.
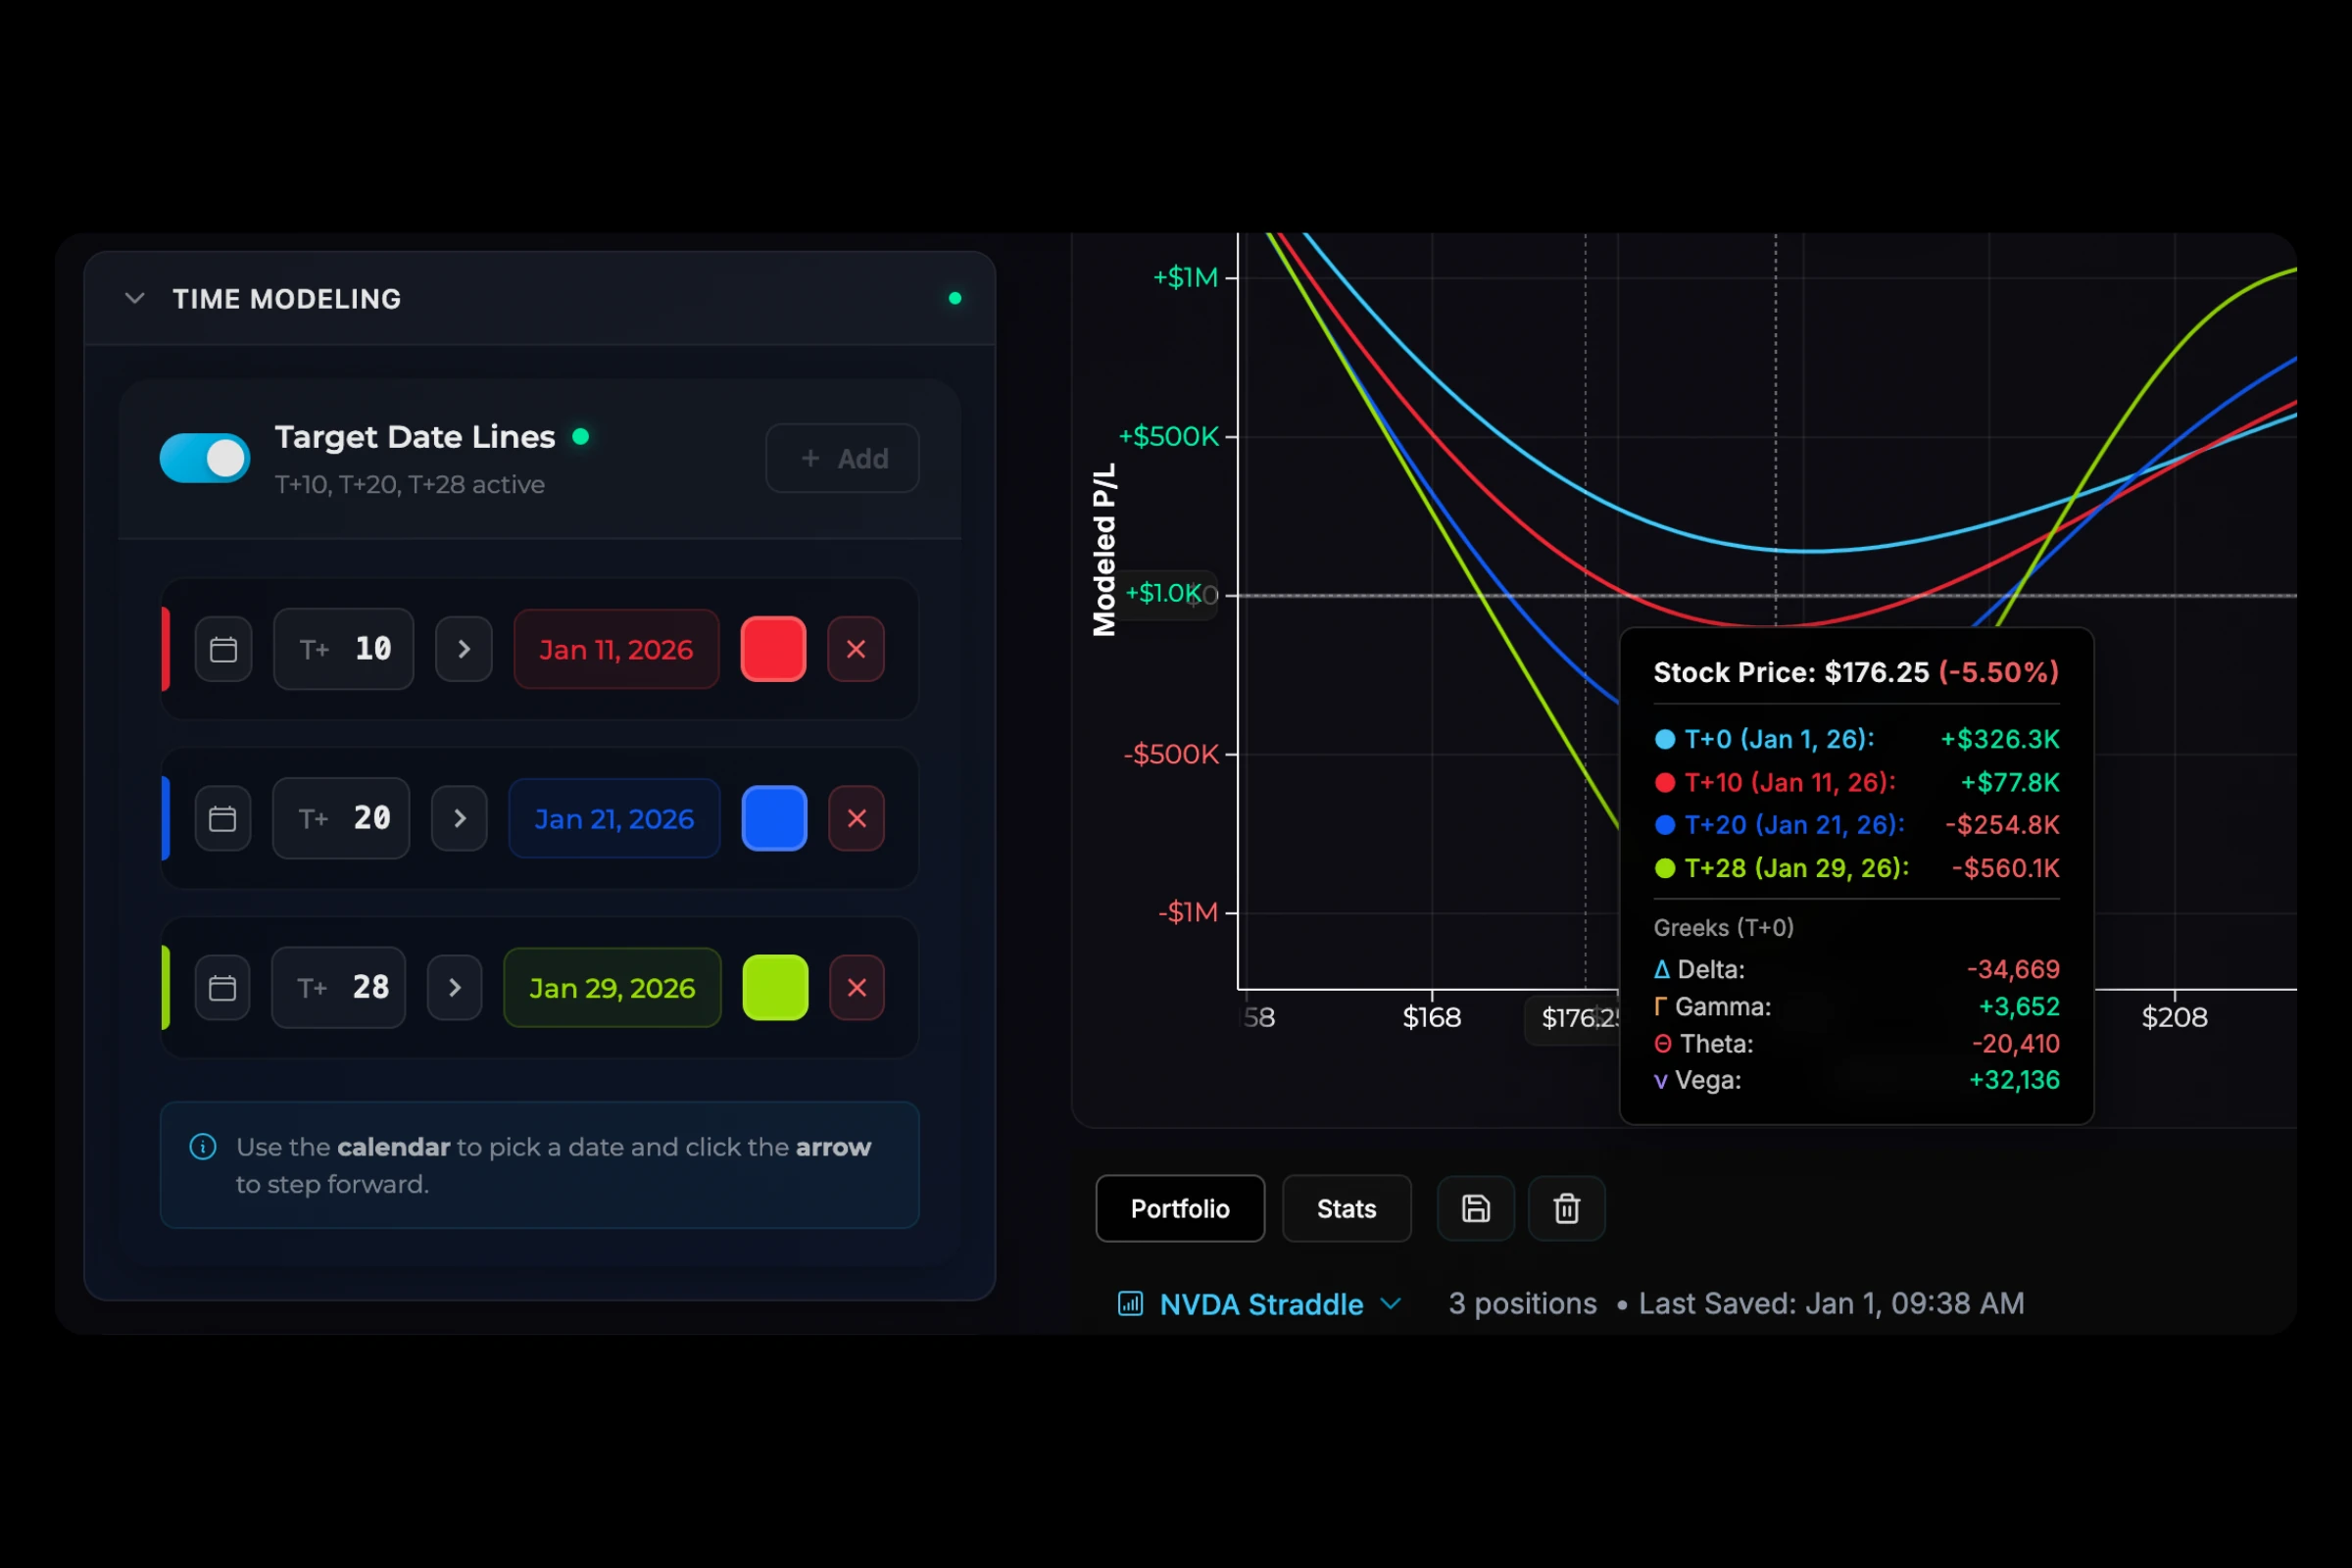
Time Decay Modeling
See how time works for or against you. T+ lines show how your P/L curve shifts as expiration approaches.
Ready to see your risk clearly?
Start modeling your options positions today.
Get Started