Adjustment Modeling
Compare your current position against proposed trades before committing.
What is Adjustment Modeling?
Adjustment Modeling lets you simulate proposed trades against your current portfolio before executing them. Add hypothetical positions to see how they would change your P/L curves, Greeks, and overall risk profile.
Enabling Adjustment Mode
- Open the Adjustment Modeling tab in the left panel
- Toggle Adjustment Mode to ON
When enabled:
- Your current portfolio becomes the baseline (frozen for comparison)
- Any new positions you add become proposed adjustments
- The P/L chart displays both baseline and adjusted curves
Adding Proposed Adjustments
With adjustment mode enabled, add positions from the options chain:
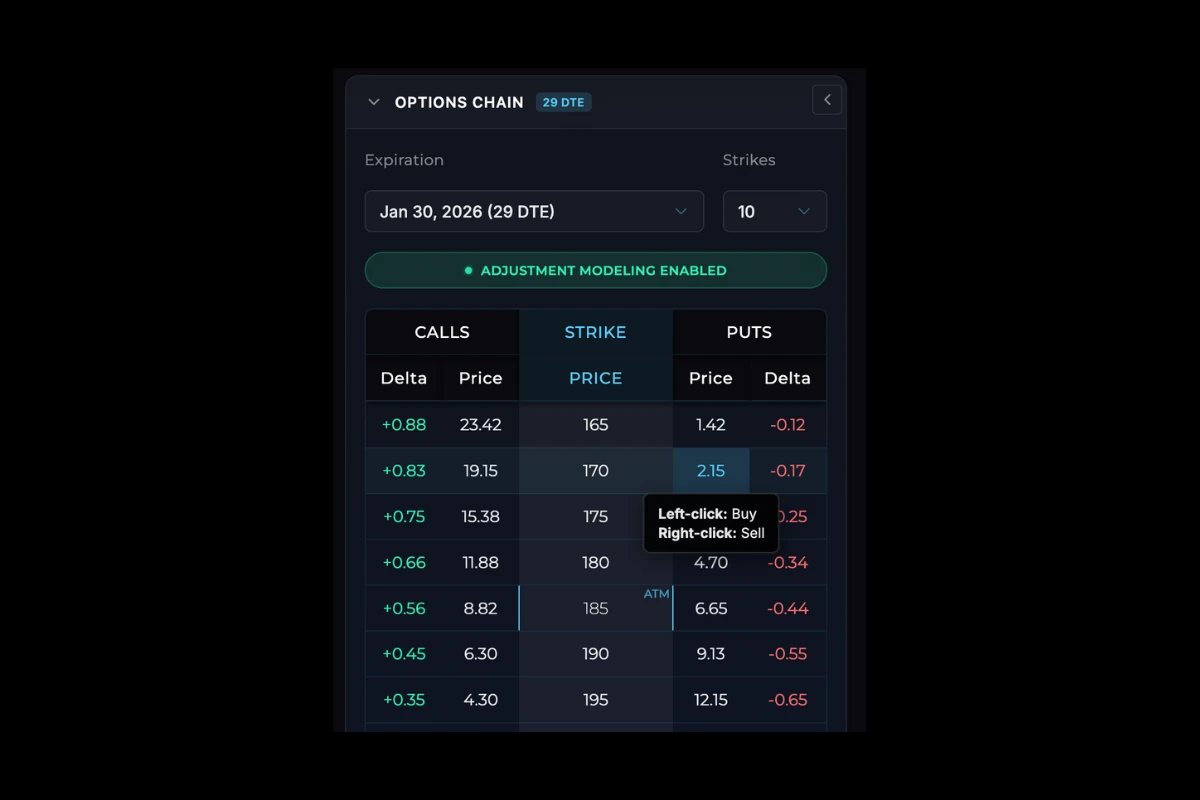
- Left-click to add a proposed buy
- Right-click to add a proposed sell
Proposed adjustments appear in the Adjustment Modeling panel with a “Proposed” indicator. They do not appear in your main portfolio table.
Editing Adjustments
Each proposed adjustment can be modified inline:
- Quantity - Click to edit the number of contracts
- Entry Price - Click to change the simulated fill price
- Remove - Click the X to delete individual adjustments
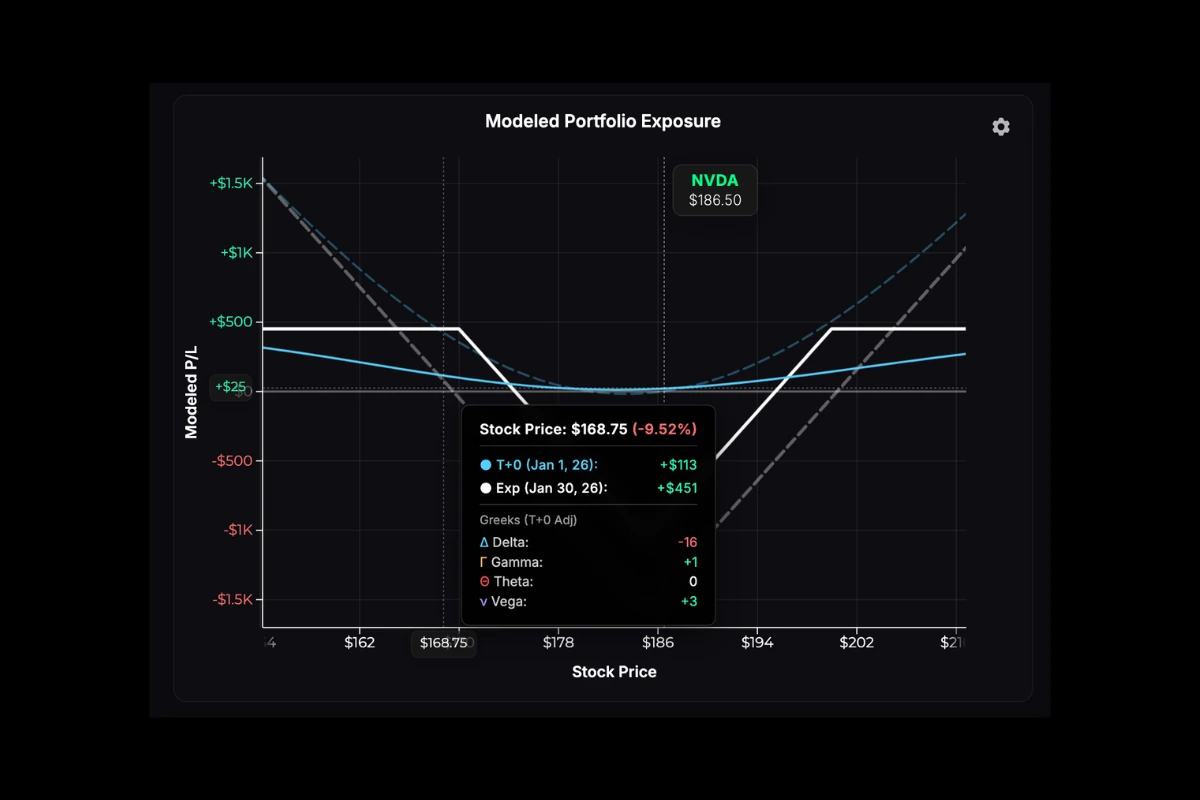
Understanding the Curves
The P/L chart shows two sets of curves when adjustment mode is active:
| Curve Type | Appearance | What It Shows |
|---|---|---|
| Baseline | Dashed, lower opacity | Your current positions only |
| Adjusted | Solid lines | Current positions + proposed adjustments |
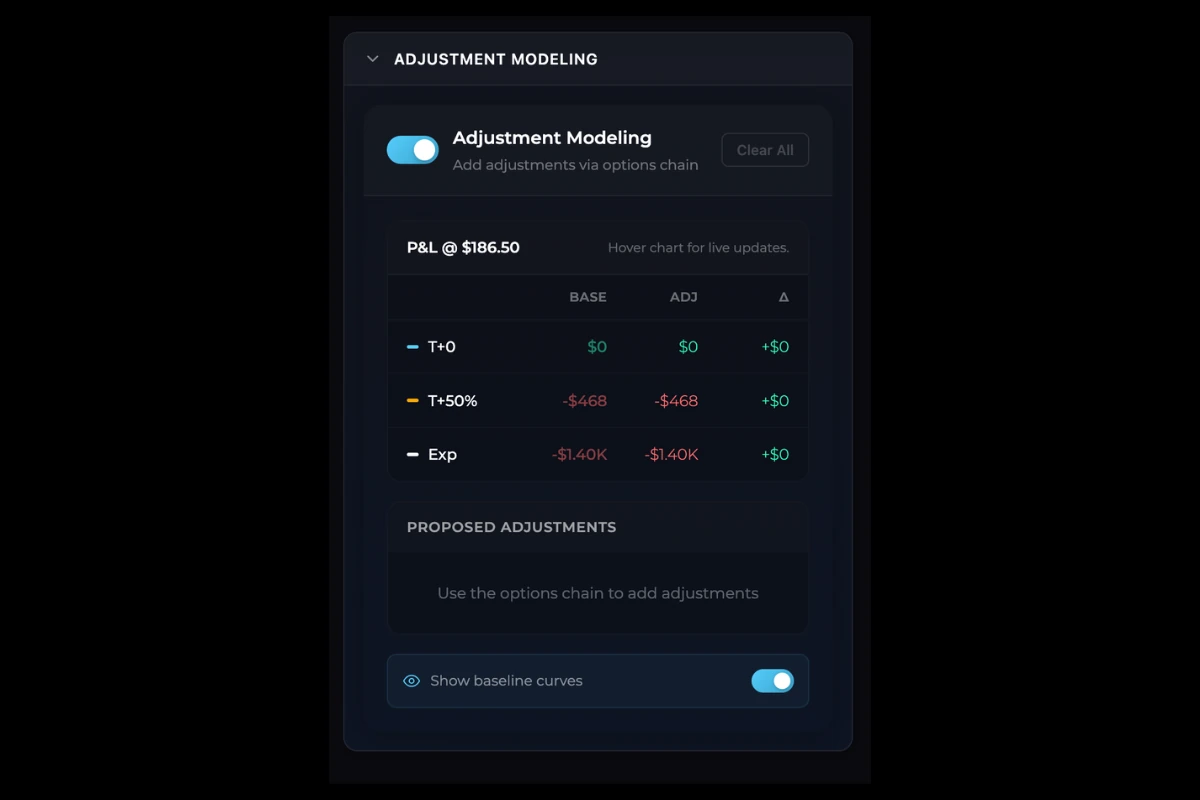
Reading the Base/Adj/Delta Table
When you hover over the chart, the tooltip displays three values:
| Column | Definition |
|---|---|
| Base | P/L from your current positions only |
| Adj | P/L from current positions + proposed adjustments |
| Delta | The difference (Adj minus Base) |

Interpreting Delta
- Positive delta → Your proposed adjustments are projected to outperform holding your current positions at that stock price and point in time
- Negative delta → Your proposed adjustments are projected to underperform holding your current positions at that stock price and point in time
This helps you quickly see whether your proposed trades would improve or worsen your position across different price scenarios.
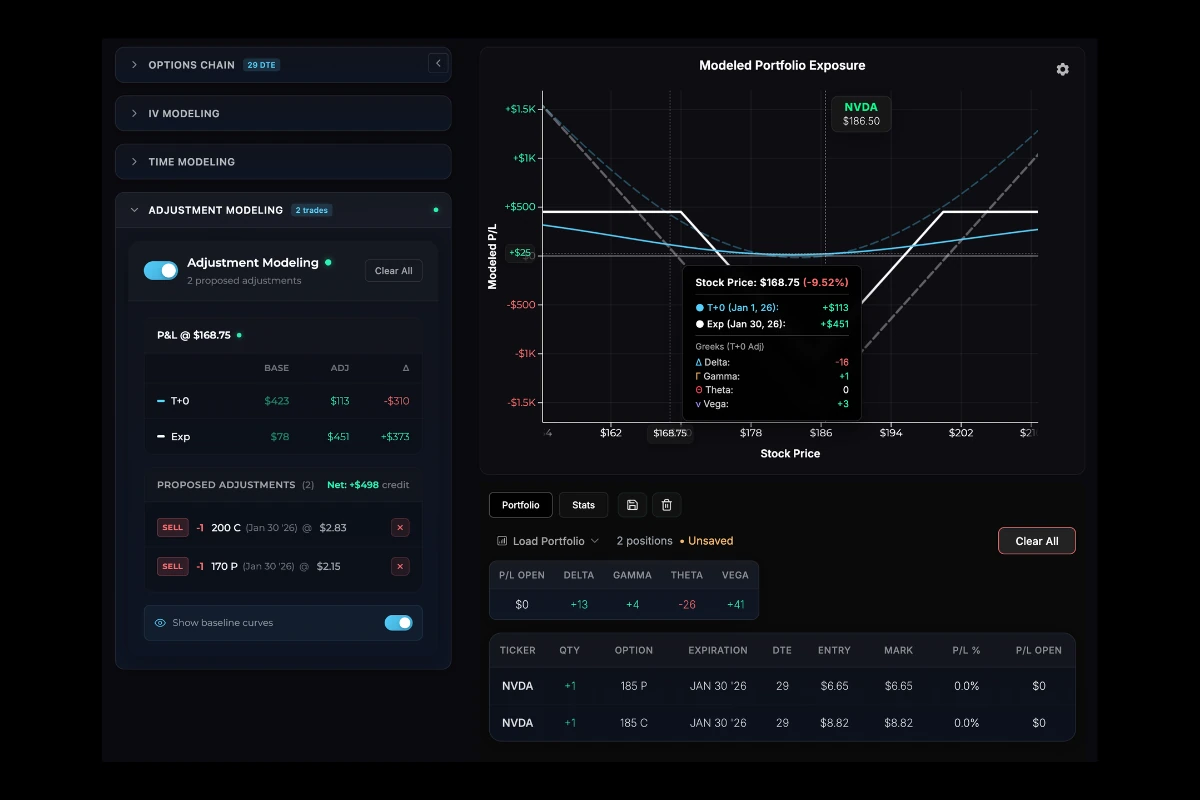
Net Credit/Debit
The panel displays the net premium for all proposed adjustments:
| Value | Meaning |
|---|---|
| Positive (Credit) | You would receive premium |
| Negative (Debit) | You would pay premium |
This shows the direct cost or credit of executing all proposed trades.
Controls
- Clear All - Remove all proposed adjustments at once
- Toggle OFF - Disable adjustment mode and return to normal view
Note: All adjustments in projectoption are modeled simulations only.
Was this page helpful?