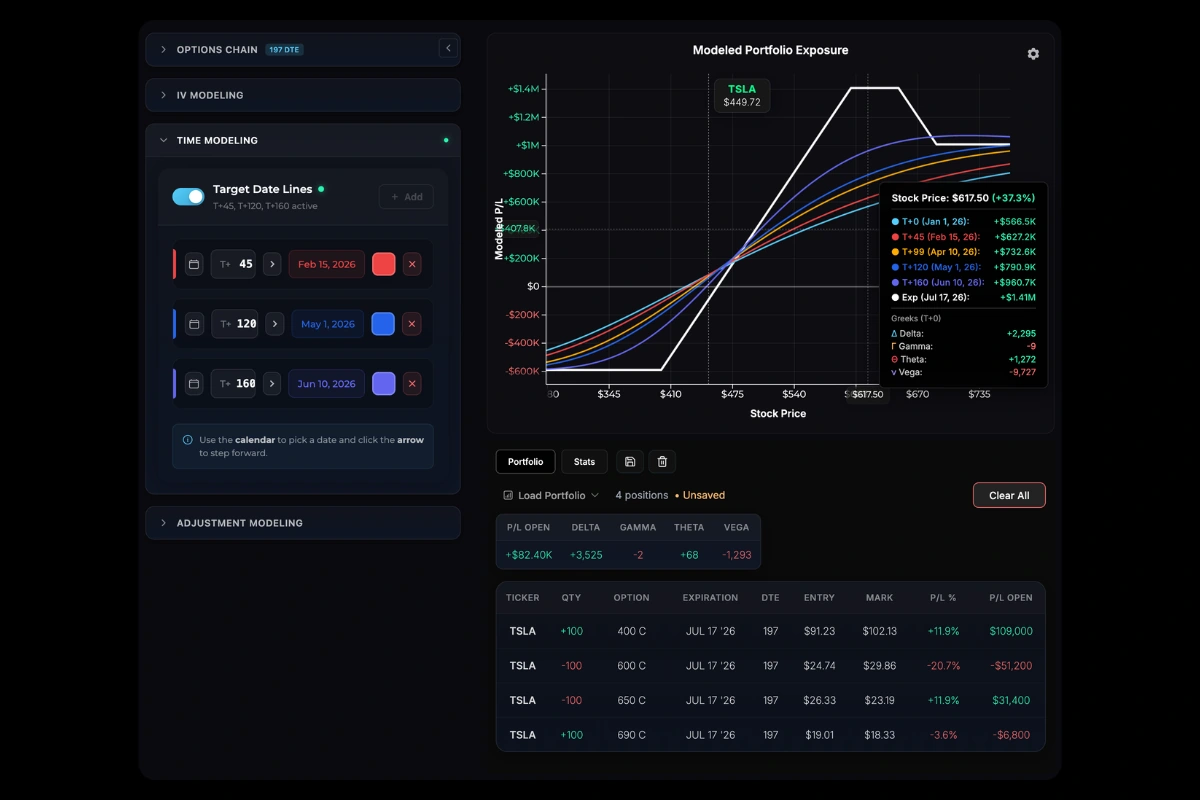
Time Modeling
Visualize how time decay affects your portfolio with custom target date lines.
What is Time Modeling?
Time Modeling lets you project your portfolio’s P/L at specific future dates. Add custom T+ lines to see how your curves will look as time passes and theta decay takes effect.
Default Lines
By default, projectoption displays three lines:
| Line | Color | What It Shows |
|---|---|---|
| T+0 | Cyan | Today’s theoretical P/L |
| T+50% | Orange | Halfway to expiration |
| Expiration | White | P/L at expiration (intrinsic value only) |
For portfolios with multiple expirations, the Exp dropdown controls which expiration the T+50% and Expiration lines reference. See P/L Curves — Expiration Anchoring for details.
Adding Target Lines
- Open the Time Modeling tab in the left panel
- Click Add Target Line (up to 3 custom lines allowed)
- Set the DTE (days to expiration) for your projection
- Choose a color to distinguish the line
Adjusting DTE
Several ways to set your target date:
- Stepper buttons - Click +/- to adjust by 1 day
- Press Forward - Hold the button to rapidly increment
- Direct input - Click the number and type a specific DTE
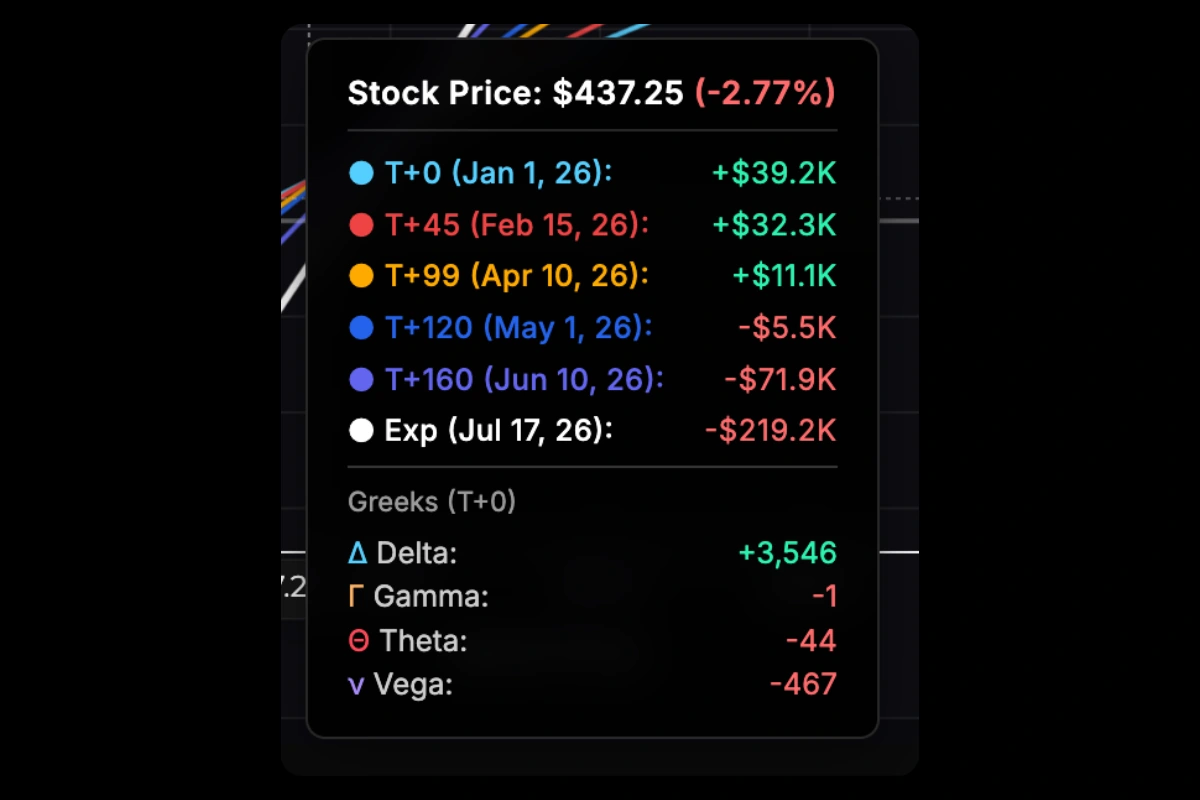
Chart Tooltip
Hover over the P/L chart to see your specific T+ lines and the modeled P/L of your portfolio at various stock prices and your chosen points in the future:
Removing Lines
Click the X button on any custom target line in the Time Modeling panel to remove it from the chart.
Was this page helpful?