Quick Start Guide
Get started with projectoption.
Quick Start
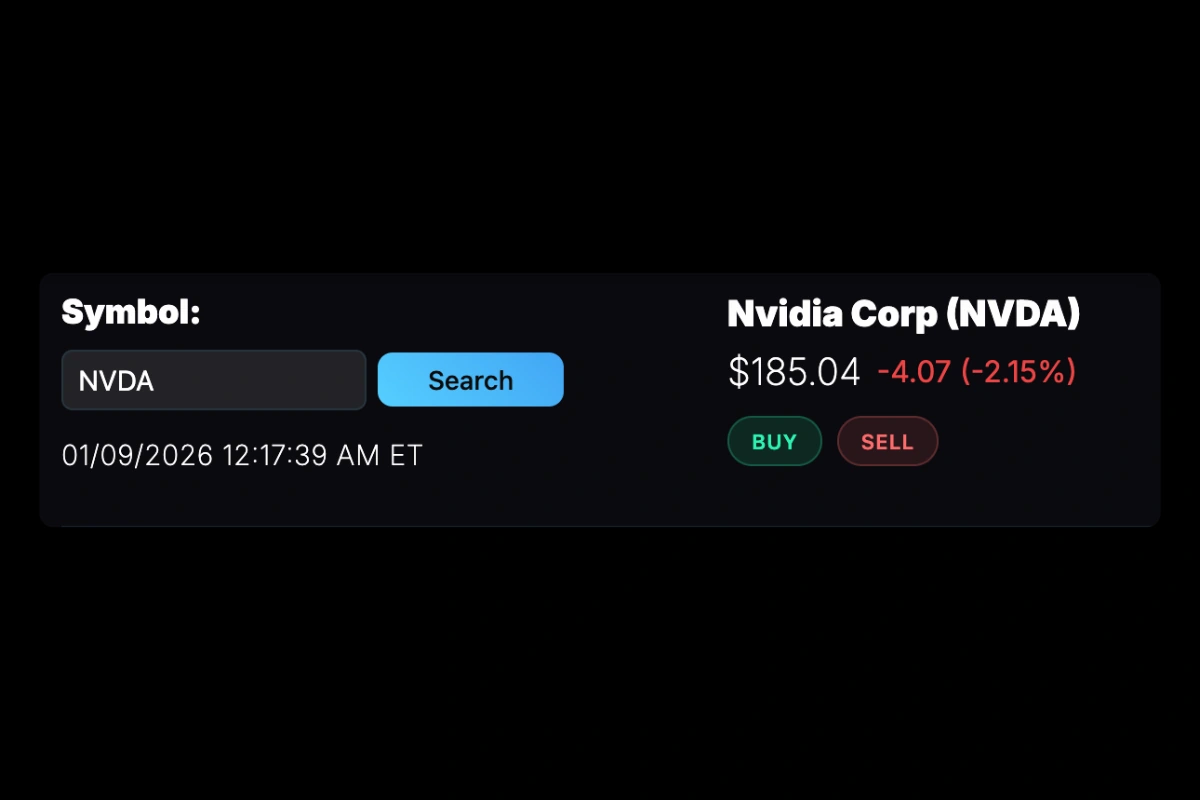
1. Search for a Stock
Use the search bar to find any optionable stock by ticker (AAPL, SPY, TSLA, etc.).
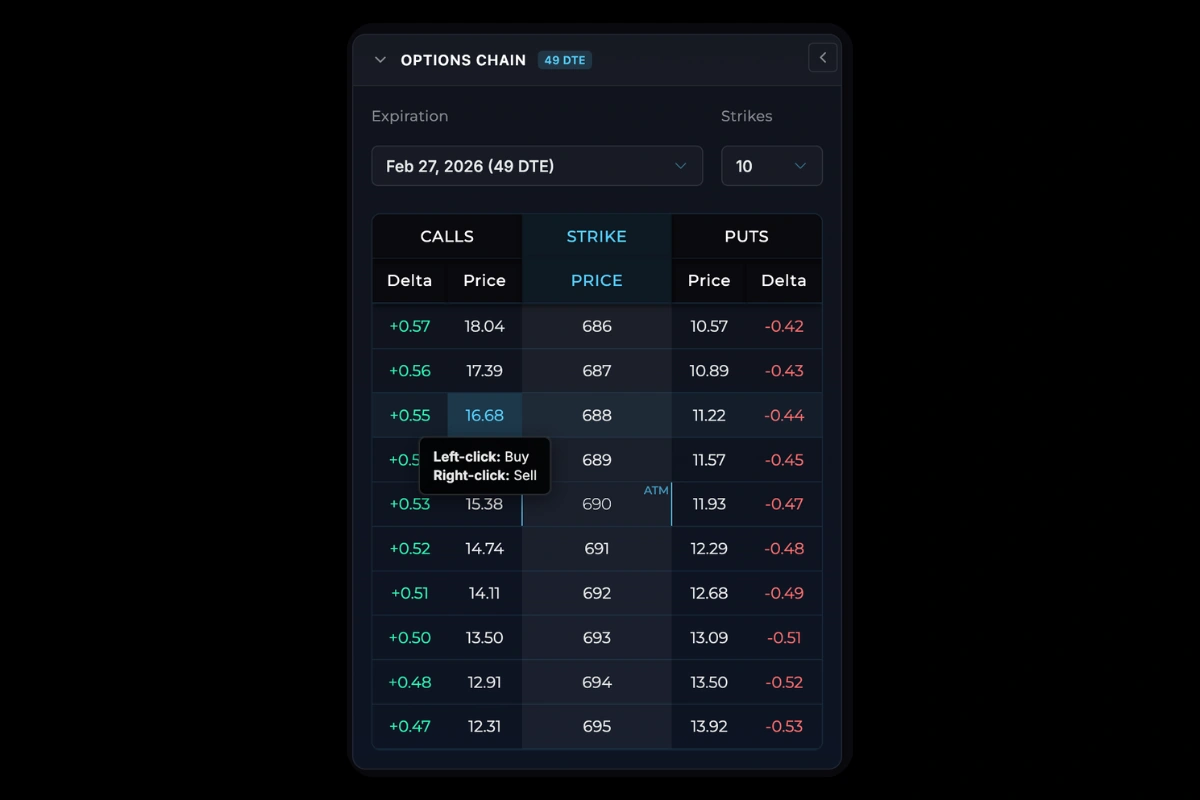
2. Browse the Options Chain
The options chain appears on the left side:
Select an expiration from the dropdown.
- Calls on the left
- Strike prices in the center
- Puts on the right
- Custom column showing Delta, Volume, or Open Interest
3. Add Positions
| Action | How |
|---|---|
| Buy option | Left-click on price |
| Sell option | Right-click on price |
| Buy/Sell stock | Buttons below stock price display |
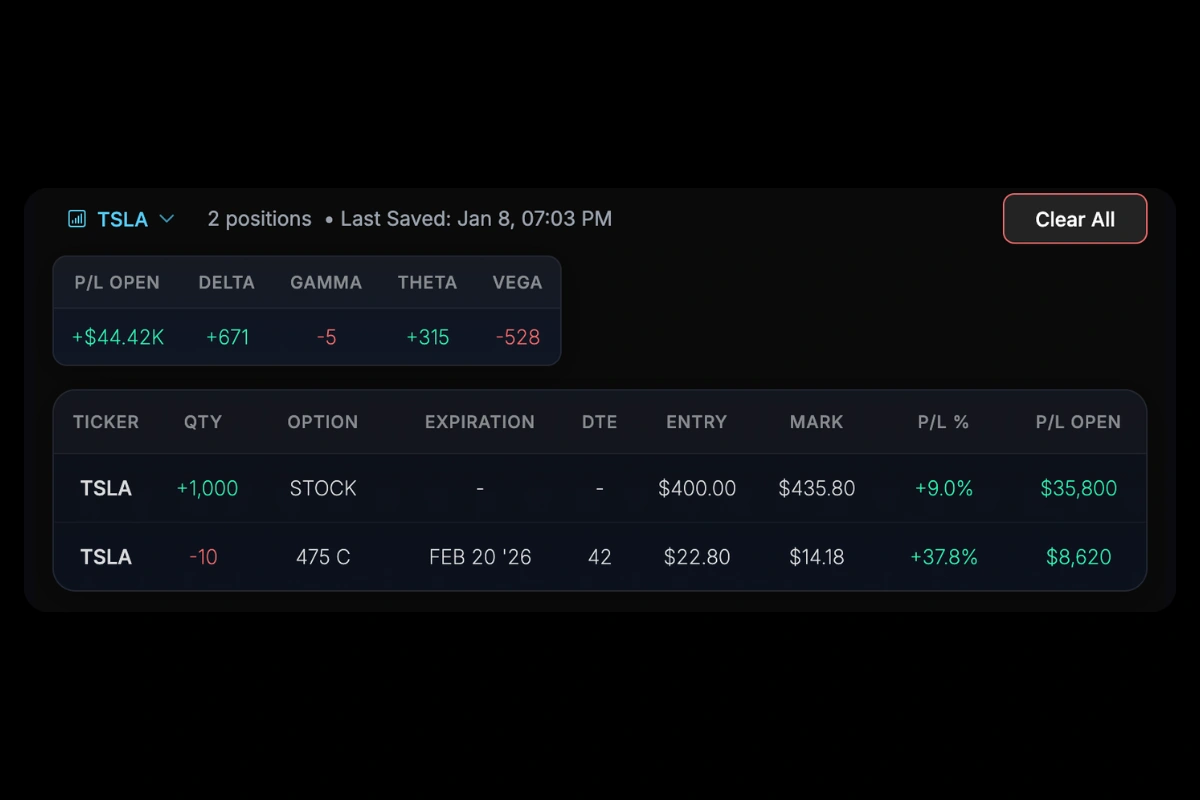
4. Manage Positions
In the portfolio table (bottom right), you can edit quantity or entry price directly.
Right-click any row for more options:
- View Details — Full option details
- Flip — Reverse quantity (long ↔ short)
- Exclude from Projections — Hide from P/L chart
- Delete — Remove position
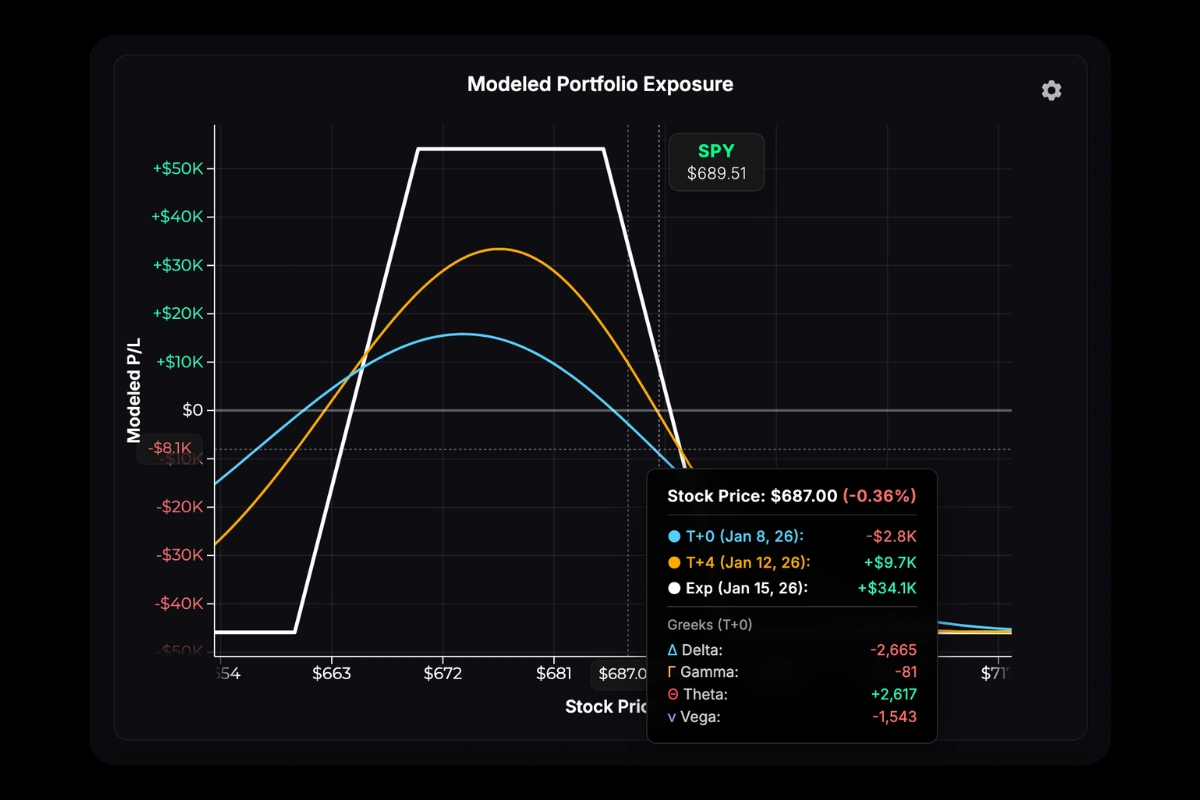
5. Read the P/L Chart
The chart shows your theoretical P/L across stock prices. See P/L Curves for details on interpreting the T+0, T+50%, and Expiration lines.
6. Modeling Tools
Below the options chain, three tabs let you model scenarios:
Time Modeling Add custom T+ lines to project P/L at specific future dates.

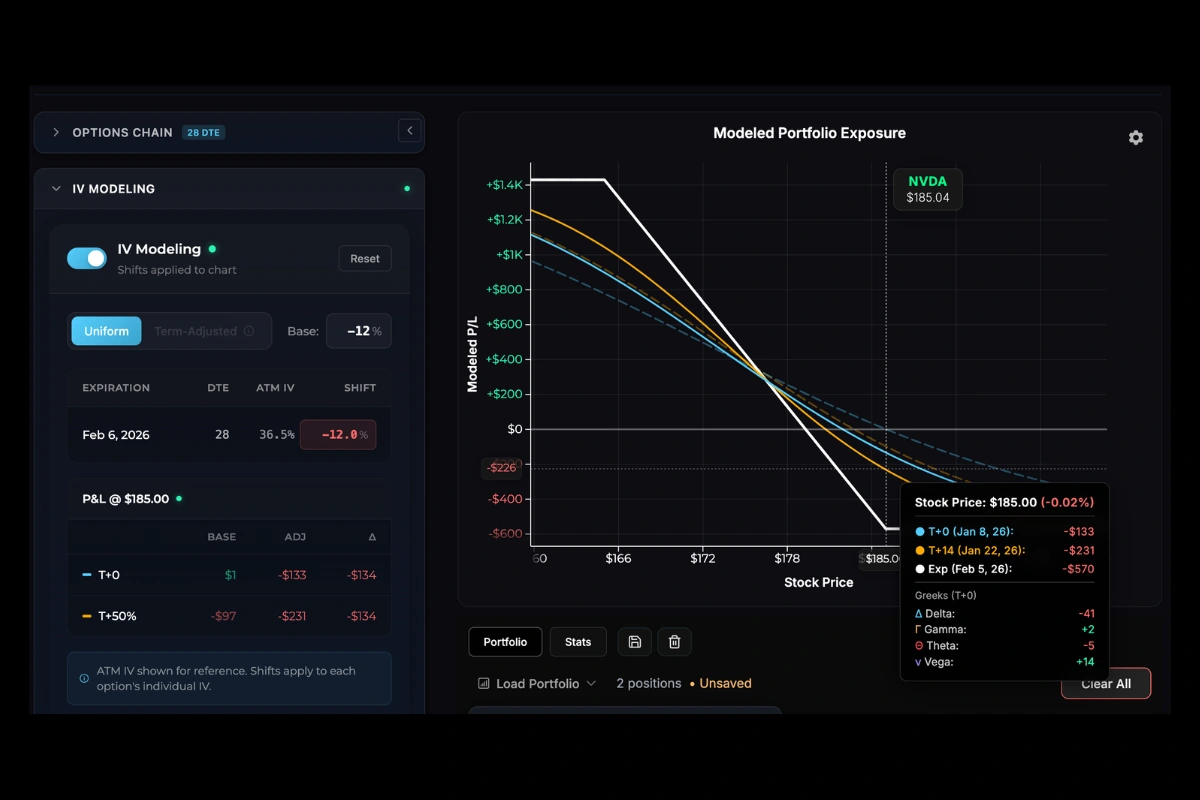
IV Modeling Shift implied volatility up or down to visualize vega exposure.
Adjustment Modeling Compare your current position against proposed trades. Add new positions from the chain—they appear as proposed adjustments with a separate curve overlay. Hover the chart to see P/L differences at various prices and time points.

Next Steps
- P/L Curves — Chart interpretation
- T+ Lines — Custom time projections
Was this page helpful?